Whatcom Community College Nursing Programs
Located in Bellingham, Washington, Whatcom Community College is a public institution. Bellingham is a great location for students who prefer city over country life.
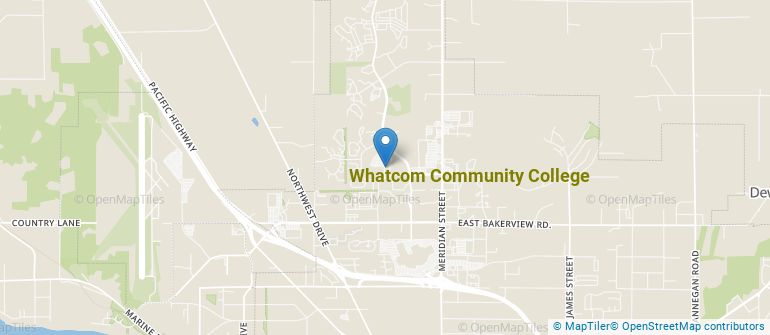
Where Is Whatcom Community College?

Contact details for Whatcom Community College are given below.
| Contact Details | |
|---|---|
| Address: | 237 W Kellogg Rd, Bellingham, WA 98226 |
| Phone: | 360-383-3000 |
| Website: | whatcom.edu |
How Do I Get Into Whatcom Community College?
You can apply to Whatcom Community College online at: whatcom.edu/future-students/get-started-at-orca-central/apply-now
Can I Afford Whatcom Community College?
Student Loan Debt
Almost 66% of college students who graduated with the class of 2018 took out student loans, but that percentage varies from school to school. At Whatcom Community College, approximately 6% of students took out student loans averaging $5,103 a year. That adds up to $20,412 over four years for those students.
Whatcom Community College Undergraduate Student Diversity

Gender Diversity
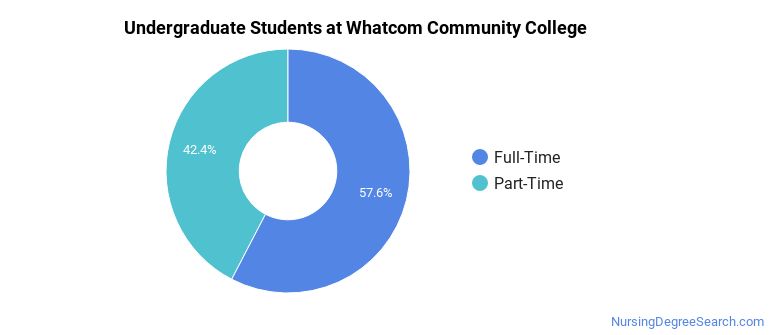
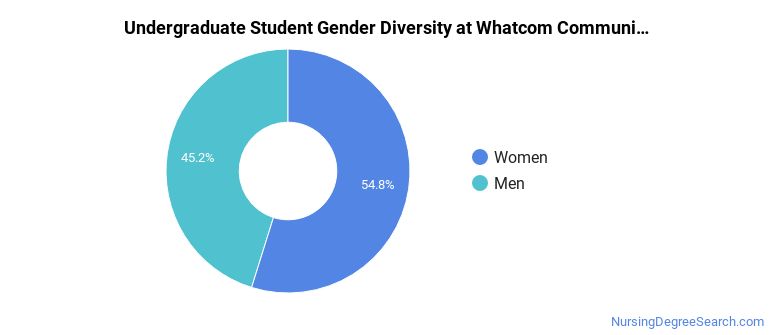
Of the 1,567 full-time undergraduates at Whatcom Community College, 45% are male and 55% are female.

Racial-Ethnic Diversity
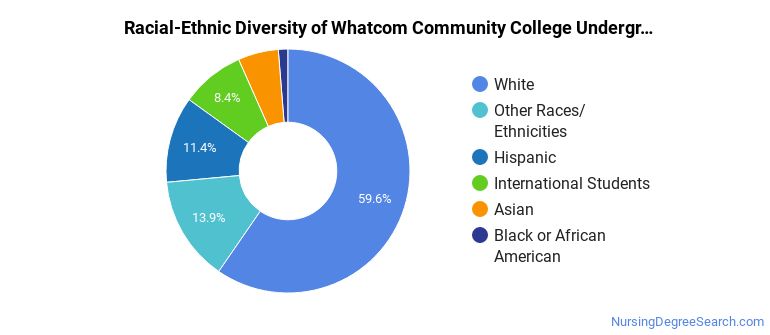
The racial-ethnic breakdown of Whatcom Community College students is as follows.

| Race/Ethnicity | Number of Grads |
|---|---|
| Asian | 84 |
| Black or African American | 20 |
| Hispanic or Latino | 179 |
| White | 934 |
| International Students | 132 |
| Other Races/Ethnicities | 218 |
Over 32 countries are represented at Whatcom Community College. The most popular countries sending students to the school are Vietnam, China, and Japan.
Whatcom Community College Nursing Concentrations
The table below shows the number of awards for each concentration.
| Major | Basic Certificate | Associate’s | TOTAL |
|---|---|---|---|
| Registered Nursing | 0 | 33 | 33 |
| Nursing Assistant/Aide and Patient Care Assistant/Aide | 27 | 0 | 27 |
| TOTAL | 27 | 33 | 60 |
References
*The racial-ethnic minorities count is calculated by taking the total number of students and subtracting white students, international students, and students whose race/ethnicity was unknown. This number is then divided by the total number of students at the school to obtain the racial-ethnic minorities percentage.
More about our data sources and methodologies.
