Pierce College-Fort Steilacoom Nursing Programs
Pierce College-Fort Steilacoom is a public institution located in Lakewood, Washington. The city atmosphere of Lakewood makes it a great place for students who enjoy having lots of educational and entertainment options.
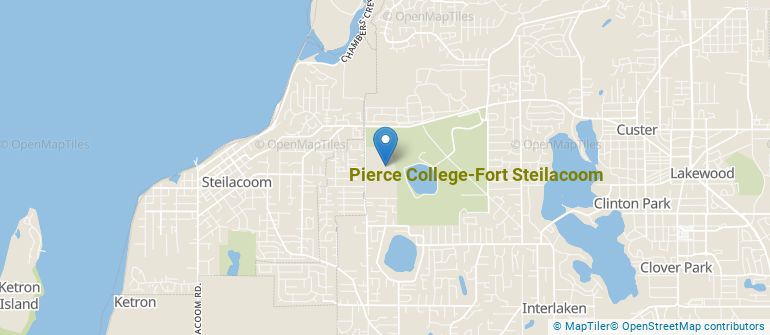
Where Is Pierce College-Fort Steilacoom?

Contact details for Pierce College-Fort Steilacoom are given below.
| Contact Details | |
|---|---|
| Address: | 9401 Farwest Dr Sw, Lakewood, WA 98498-1999 |
| Phone: | 253-964-6500 |
| Website: | www.pierce.ctc.edu |
How Do I Get Into Pierce College-Fort Steilacoom?
You can apply to Pierce College-Fort Steilacoom online at: www.pierce.ctc.edu/admissions
Can I Afford Pierce College-Fort Steilacoom?
Student Loan Debt
Almost 66% of college students who graduated with the class of 2018 took out student loans, but that percentage varies from school to school. At Pierce College-Fort Steilacoom, approximately 15% of students took out student loans averaging $5,232 a year. That adds up to $20,928 over four years for those students.
Pierce College-Fort Steilacoom Undergraduate Student Diversity

Gender Diversity
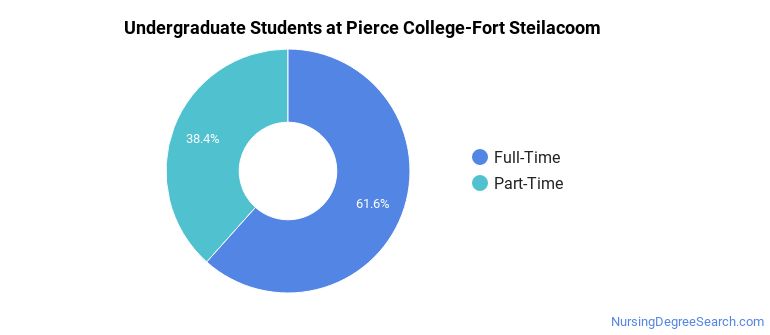
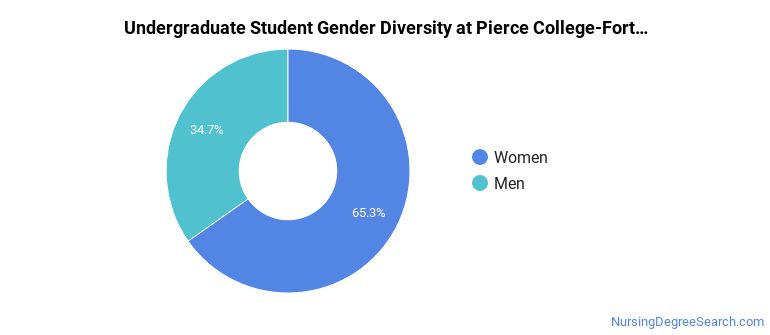
Of the 5,131 full-time undergraduates at Pierce College-Fort Steilacoom, 35% are male and 65% are female.

Racial-Ethnic Diversity
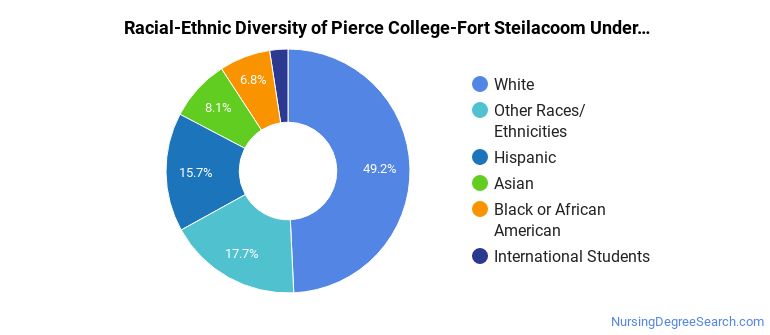
The racial-ethnic breakdown of Pierce College-Fort Steilacoom students is as follows.

| Race/Ethnicity | Number of Grads |
|---|---|
| Asian | 417 |
| Black or African American | 347 |
| Hispanic or Latino | 807 |
| White | 2,527 |
| International Students | 124 |
| Other Races/Ethnicities | 909 |
Over 39 countries are represented at Pierce College-Fort Steilacoom. The most popular countries sending students to the school are Vietnam, China, and South Korea.
Pierce College-Fort Steilacoom Nursing Concentrations
The table below shows the number of awards for each concentration.
| Major | Associate’s | TOTAL |
|---|---|---|
| Registered Nursing | 77 | 77 |
| TOTAL | 77 | 77 |
References
*The racial-ethnic minorities count is calculated by taking the total number of students and subtracting white students, international students, and students whose race/ethnicity was unknown. This number is then divided by the total number of students at the school to obtain the racial-ethnic minorities percentage.
More about our data sources and methodologies.
